

On January 26, 2026, the Non-Consulting Services category saw significant procurement activity with 73 new tenders valued at $1.26 billion USD, while 6 contracts worth $33.6 million were awarded. South Africa dominated as the primary sourcing country, and the average bid window remained tight at just under 16 days. This analysis breaks down the day’s key metrics, geographic distribution, award patterns, and strategic implications for suppliers.
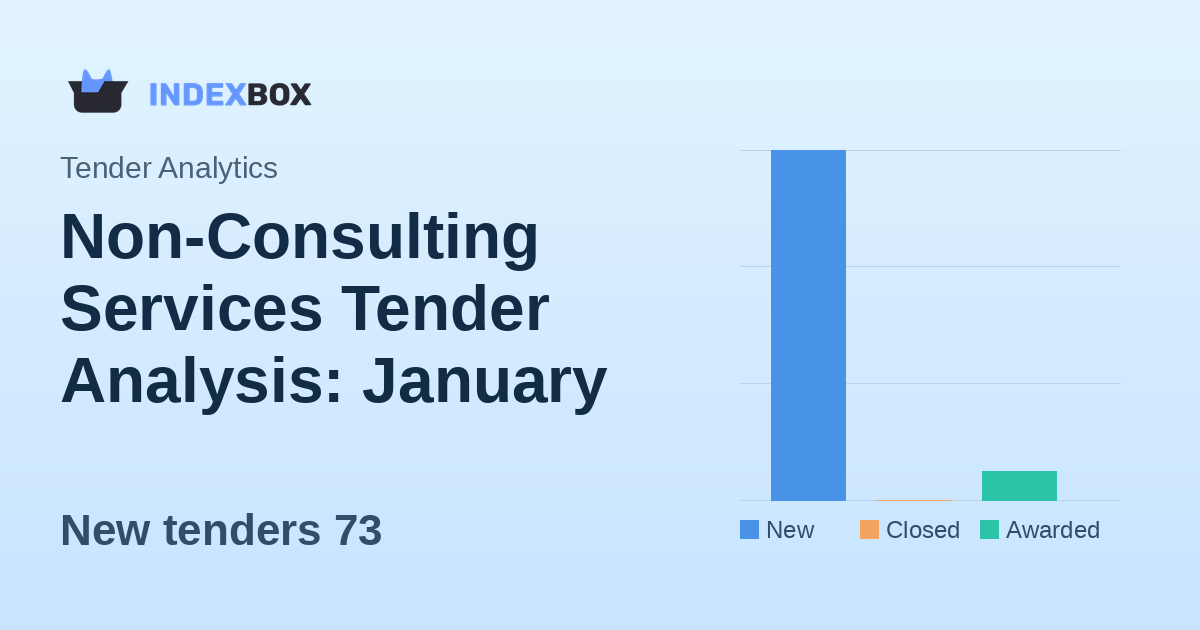
New tenders73
Closed tenders0
Awarded tenders6
Bid window15.8 days
RCI Technologies Inc (1133 Green Street)
1
Repeat winners to benchmark or partner with.
Barrosa Brothers Corp (3763 83rd Street)
1
Repeat winners to benchmark or partner with.
Tully Environmental Inc (127-50 Northern Blvd.)
1
Repeat winners to benchmark or partner with.
South Africa
United Kingdom
United States
Non-Consulting Services
Full analysis
Daily Snapshot: High-Value Activity in Non-Consulting Services
January 26, 2026, was a day of substantial new procurement issuance within the global Non-Consulting Services category. A total of 73 new tenders were published, representing a combined potential contract value of $1,256,679,954.40 USD. This indicates robust public and private sector investment in operational, maintenance, and implementation services that fall outside traditional consulting frameworks.
Concurrently, the market saw closure on 6 tenders through awards, with a total awarded value of $33,593,033.00 USD. Notably, no tenders were reported as closed without award, suggesting all processes reaching conclusion on this day resulted in successful contractor selection. The disparity between the new tender value and the awarded value highlights the pipeline nature of procurement, where large-value opportunities enter the market while smaller, matured processes are finalized.
The data shows a concentrated release of opportunities, with all 73 new tenders classified under the overarching ‘Non-Consulting Services’ sector. This lack of sub-sector granularity in the provided metrics suggests the day’s activity was broad-based, potentially encompassing a wide range of service types from facilities management and IT support to transportation and security services.
- 73 new tenders published with a total value of ~$1.26 billion USD.
- 6 tenders awarded, totaling ~$33.6 million USD in contracted value.
- 0 tenders closed without award, indicating 100% award rate for concluded processes.
- All new activity concentrated in the broad ‘Non-Consulting Services’ sector.
Geographic and Temporal Dynamics: South Africa Leads with Tight Deadlines
Geographic analysis reveals a highly concentrated sourcing landscape for January 26. South Africa was the dominant origin for new tenders, accounting for 55 of the 73 total new opportunities (approximately 75%). The United Kingdom followed distantly with 12 tenders, and the United States issued 6. This concentration suggests specific national or regional procurement drives, particularly in South Africa, which suppliers should monitor closely.
A critical metric for bid preparation is the average bid window, which stood at 15.84 days. This is a relatively short timeframe for suppliers to prepare and submit compliant proposals. The sub-16-day average underscores the need for suppliers to have streamlined internal processes, pre-qualified documentation, and rapid response capabilities to compete effectively in this market segment.
The currency for all reported values is the US Dollar (USD), which simplifies financial analysis for international bidders but may indicate that the tenders, even those sourced from countries like South Africa and the UK, are valued or reported in a common international currency. This is a crucial consideration for managing foreign exchange risk in pricing strategies.
- South Africa sourced 55 tenders (75% of daily total).
- United Kingdom and United States sourced 12 and 6 tenders, respectively.
- Average bid window of 15.84 days demands rapid response from suppliers.
- All financial values reported in USD, centralizing currency risk assessment.
Award Analysis: Distributed Wins Among Five Companies
The award activity on January 26 resulted in a distributed win pattern, with five distinct companies each securing one contract. The winners were RCI Technologies Inc, Barrosa Brothers Corp, Tully Environmental Inc, YSKOUD LLC, and Sienia Construction Inc. The inclusion of addresses (e.g., ‘1133 Green Street’) in the data suggests these may be specific legal entities or branches, which is valuable information for competitive intelligence and partnership identification.
The fact that each of the six awarded tenders went to a separate company (with one company potentially winning two, though the data lists five names for six awards, implying a possible data presentation nuance or a duplicate win not explicitly detailed) indicates a competitive and fragmented award landscape. No single supplier dominated the day’s awards, which can be encouraging for small and medium-sized enterprises (SMEs) seeking entry.
The awarded value of $33.6 million, when considered against the six awards, suggests an average contract size of approximately $5.6 million. This is significantly lower than the average implied value of the new tenders (~$17.2 million), which may indicate that the larger-value opportunities published on this day are yet to move through the evaluation and award pipeline.
- Five identified winning companies: RCI Technologies Inc, Barrosa Brothers Corp, Tully Environmental Inc, YSKOUD LLC, Sienia Construction Inc.
- Award distribution suggests a competitive, non-concentrated market for successful bidders.
- Average awarded contract value approximately $5.6 million USD.
- Address details provided for winners aid in precise competitor mapping.
Strategic Implications for Procurement Professionals and Suppliers
For suppliers, the data from January 26, 2026, presents a clear call to action: prioritize monitoring South African procurement portals, as this region is currently the most active source for Non-Consulting Services opportunities. Building local capacity or partnerships could be a strategic imperative. The short average bid window of under 16 days necessitates having ‘bid-ready’ teams and standardized proposal components to accelerate response times.
Procurement analysts should note the significant volume and value of new tenders entering the market, signaling strong demand. The award of smaller, matured contracts alongside these large new announcements is a normal market rhythm. The challenge for buyers will be ensuring robust competition for the high-value tenders now advertised, potentially requiring active supplier engagement to attract qualified bidders within the tight timeframe.
The lack of sectoral breakdown within Non-Consulting Services in this dataset is a limitation for targeted analysis. Stakeholders would benefit from deeper segmentation (e.g., ‘Facilities Management’, ‘IT Services’, ‘Logistics’) to identify precise high-growth niches. Nevertheless, the overall high value indicates that the category is a major spending area, worthy of focused business development and market intelligence resources.
Looking ahead, suppliers should track whether South Africa’s dominance is a daily anomaly or a sustained trend. Similarly, observing if the awarded contract values begin to rise as the high-value tenders published on days like January 26th progress through the procurement cycle will be key to understanding future revenue pipelines.
- Suppliers must optimize for rapid bidding to meet the ~16-day average window.
- South Africa is the key geographic market to watch for new opportunities.
- The high new tender value ($1.26B) indicates a strong pipeline for future awards.
- Further data segmentation by service type would enhance strategic targeting.
Explore tenders
Source: https://www.indexbox.io/blog/tenders-2026-01-26-tender-analytics-non-consulting-services/
.


